Project Overview
Co-Finance is a full-stack financial dashboard designed to aggregate disparate stock market data into a single, unified interface.
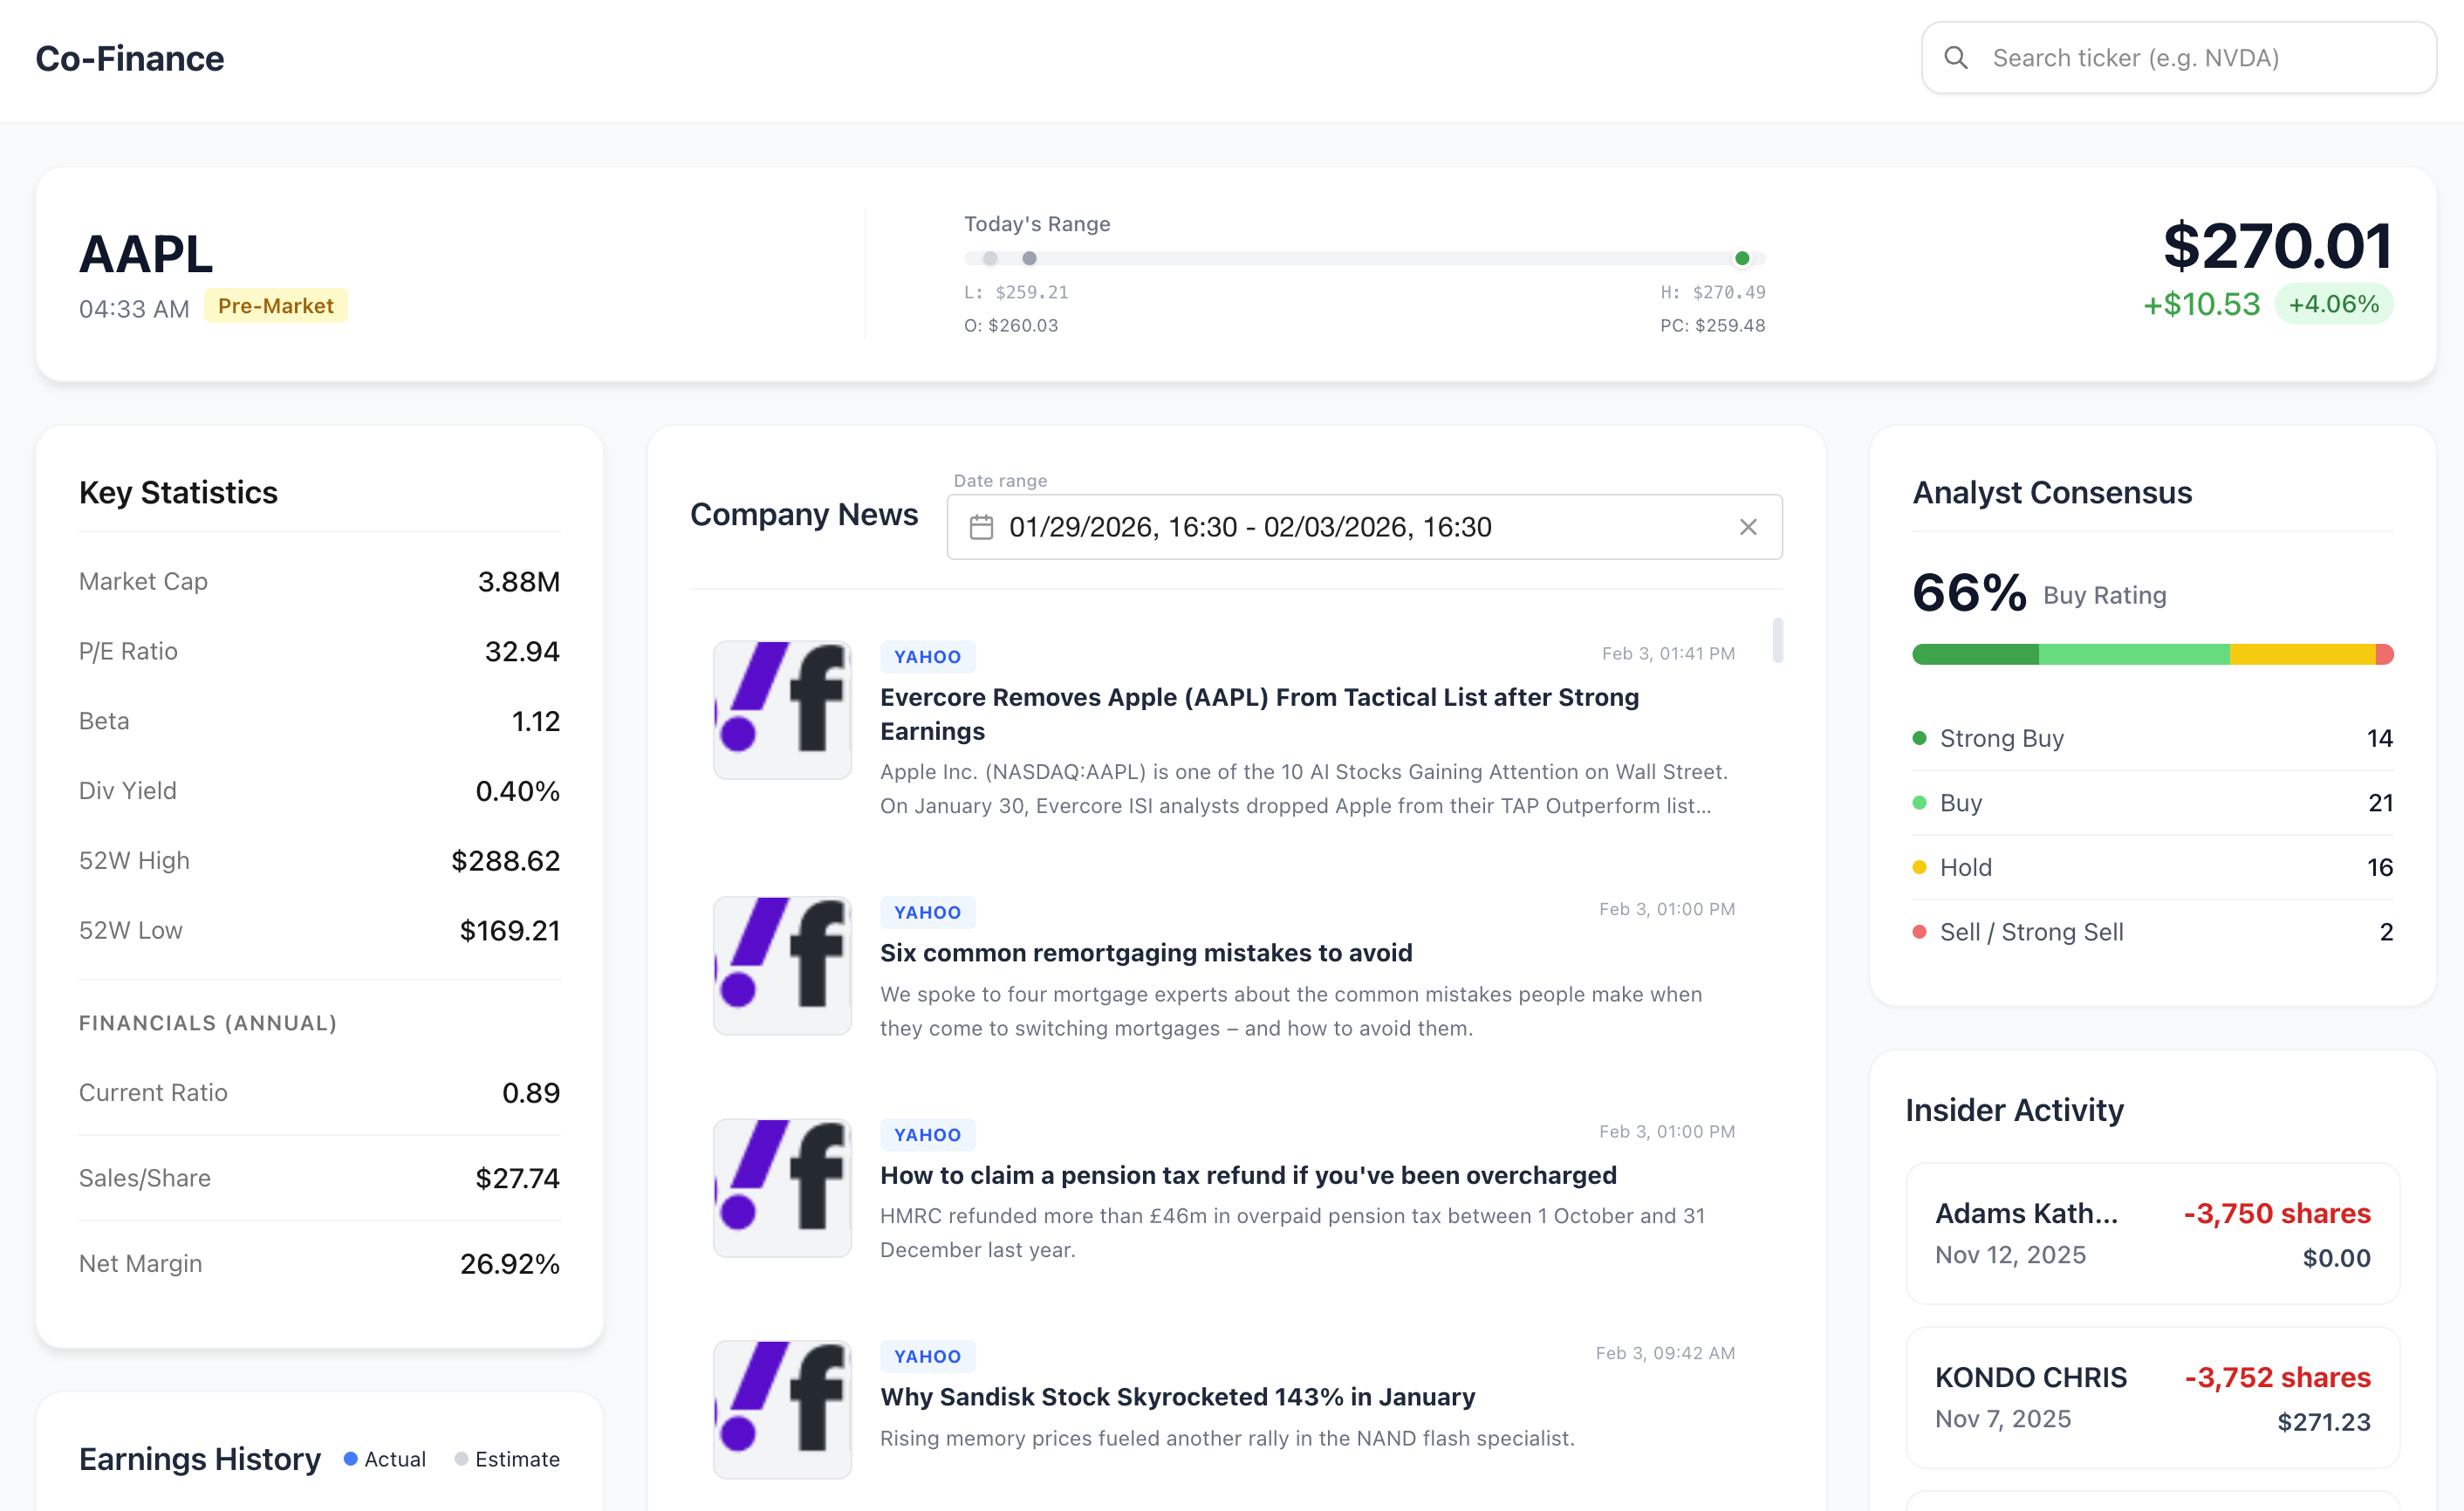
I built this system to solve the fragmentation of financial data, providing investors with a “single pane of glass” view for analyzing company health without needing to visit multiple websites.
The Problem
Market data is notoriously fragmented. Investors often have to toggle between one site for real-time prices, another for analyst ratings, and a third for insider trading reports.
This constant context-switching is time-consuming. Furthermore, fetching this data sequentially from a frontend client is slow, resulting in a “popcorn effect” where different parts of the dashboard load one by one.
The Solution
I designed Co-Finance as a centralized data aggregator built around a high-performance backend.
- Real-Time Price Streaming: I implemented WebSockets to stream live stock prices directly to the frontend.
- Concurrent Data Aggregation: For complex datasets (Financials, Earnings, Insider Trading), I designed the Go backend to utilize goroutines.
- The server fires all 5 data requests in parallel rather than sequentially.
- This reduces the total dashboard load time to the duration of the single slowest request.
- Secure Proxy Architecture: The Go server acts as a gateway, filtering raw data to minimize payload size and keeping sensitive API keys server-side, ensuring they are never exposed to the client.
- Reactive Frontend State: I implemented Pinia for state management on the Vue.js frontend. By centrally storing API responses, the application reduces redundant network requests and ensures the UI remains snappy.
Deployment & Infrastructure
To ensure the project was accessible and easy to manage, I utilized standard DevOps tools:
- Simplified Execution: I containerized the entire application using Docker. This makes running the project effortless—instead of manually installing Go, Node, and dependencies, the entire full-stack environment can be spun up with a single command.
- Automated CI/CD: I configured a GitHub Actions pipeline that automatically builds and deploys the application whenever code is pushed.
Key Features
- Live Market Data: Streams real-time price updates via WebSockets.
- Unified Data Aggregation: Combines price action, analyst consensus, and insider trading activity into one view.
- Financial Metrics: Displays key indicators (P/E Ratio, Market Cap) sourced directly from live API feeds.
Key Technical Details
- Real-Time Communication: Implemented WebSockets to handle high-frequency price updates without overloading the REST API.
- Backend Performance: Utilized Go Concurrency (Goroutines) to execute parallel API requests, significantly reducing API latency.
- State Management: Architected a centralized Pinia store to manage financial data, ensuring instant UI reactivity.
- Infrastructure: Used Docker to simplify deployment, allowing the application to be run anywhere without complex environment setup.